grack.com

I’ve decided that after nearly a year of very little activity, it’s time to start looking for a new maintainer for nprof.

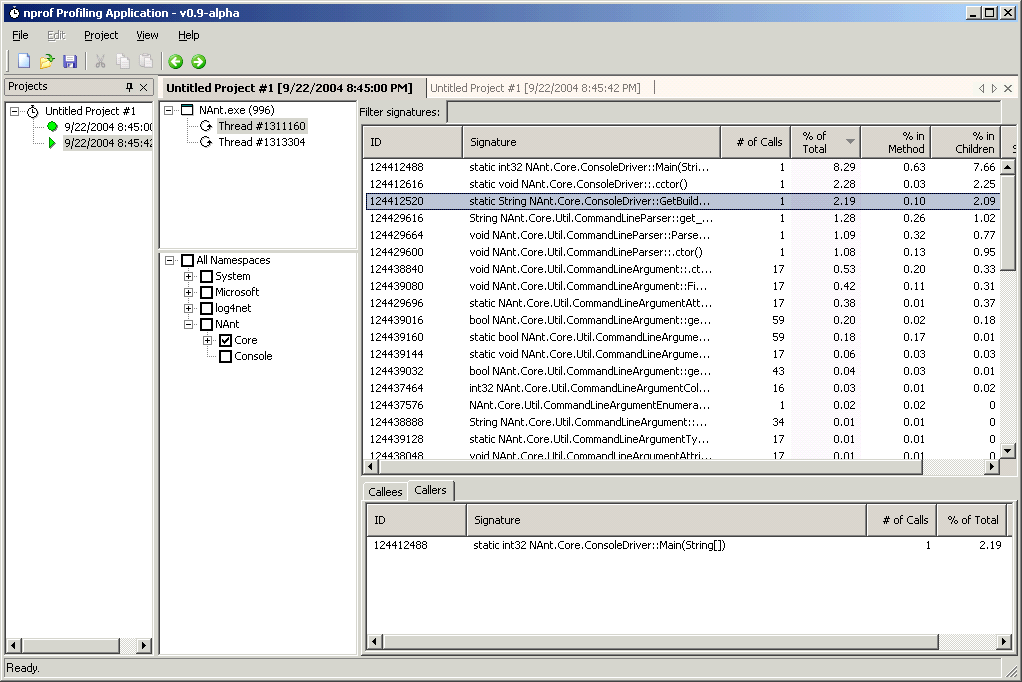
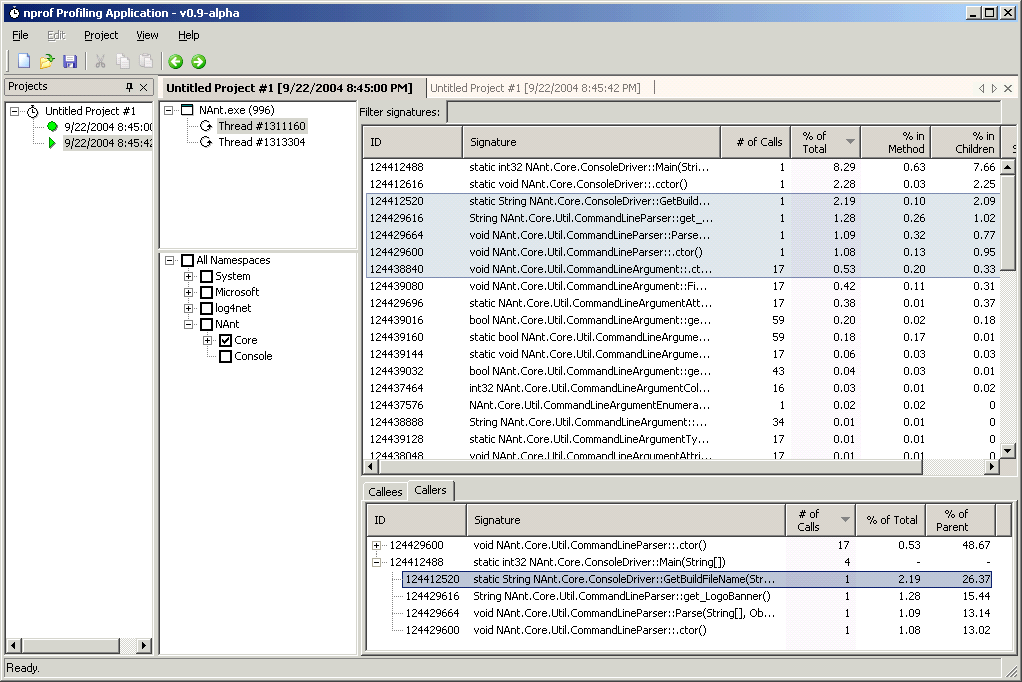
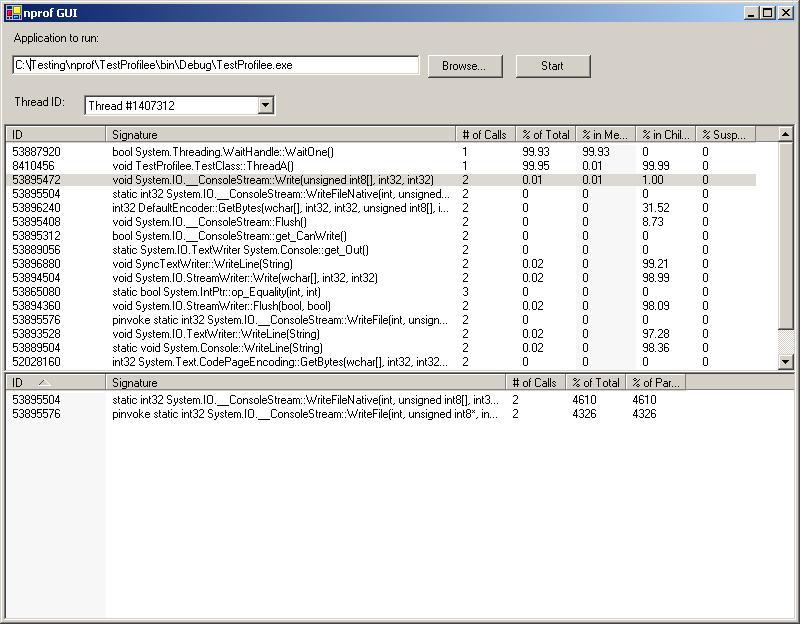
nprof is pretty much the only open-source .NET profiler on the map. It has support for multi-threaded, multi-appdomained applications and even has basic support for profiling ASP.NET.

I am sad that I have to move on from the project before it hit 1.0, but it’s clear that my limited time isn’t going to change any time soon. With someone that has time to contribute to it at the helm, I’m certain the 1.0 release will be spectacular.

Contact me either via email or on the nprof-developer mailing list if you are interested.

UPDATE: The project has moved to Google Code.

Read full post

I repackaged nprof 0.9 to include the missing msvcr70.dll that didn’t make it in the first time. With any luck, this should fix the issues with loading DotNetLib that people were having.

Read full post

The nprof 0.9 alpha release is now available. This release will fix the problems with profiling .NET applications that spawn other .NET applications, as well as improving the GUI in a number of places.

Here’s some screenshots from the new release:

Read full post

Happy Canada Day! Klaus Salchner authored an excellent article on using NProf and ACT for profiling. It’s a good introduction to profiling and optimization techniques.

Still working on 0.9, but there’s not a great deal of time to get it polished for a release. Since there are thousands of downloads for 0.8b, I want to make sure that 0.9 is stable for general use.

Read full post

Just to keep those reading the front-page news up to date, 0.9 is in development and should be out once we’ve finishing implementing and polished up some of the neat new features that will be in this release:

  • Josh’s awesome new ListView control - including, but not limited to:
    • quickfiltering
    • custom and multi-line headers
    • column reordering
    • generally nicer look than before
  • Project loading/saving (also courtesy of Josh)
  • Ashwin’s back/forward navigation code
  • A new toolbar (hasn’t been started yet, but needs to go into 0.9)

There are two known bugs that I’m hoping to get fixed for 0.9 as well:

  • Profiling on SMP systems may be buggy
  • Profiling an application that spawns another .NET application kills the profiler

Once these are done, we’ll ship 0.9 and start on the long slog to 1.0. The last remaining project goal for 1.0 is the profiler run snapshot capability. It’s certainly one of the bigger items in the roadmap, but one of the most important to take nprof to the base level of most commercial profilers.

After 1.0 is out the door, we’ll be looking for goals for the 2.0 release! Feel free to drop by the developer’s list and place your input.

Read full post

The nprof 0.8b alpha release is now available. This release should fix the ASP.NET profiling problems that have come up during the 0.8 release cycle.

Read full post

The nprof 0.8a alpha release is now available. This fixes two bugs in the 0.8 release:

  • nprof wouldn’t close completely when clicking on the close box
  • ASP.NET profiling wouldn’t work if you didn’t have an Environment key for your W3SVC or IISADMIN services

NOTE: I recommend setting up ASP.NET to run under the SYSTEM account for profiling only. Once you’ve finished profiling, you should set it back to use the “machine” user. As before, these XML attributes are available in your machine.config file.

Read full post

The nprof 0.8 alpha release is now available. Changes in this version are:

  • Basic ASP.NET profiling - note: ASP.NET must be running as SYSTEM!
  • Profile run message display
  • Detection and graceful handling of failed profiling runs
  • New icons for application and successful project run
  • Drag-and-drop of executables to the project tree (Josh)

To profile your ASP.NET application:

  1. Ensure that ASP.NET is configured to run as the SYSTEM account in machine.config
  2. Create a new project, select ASP.NET as the project type
  3. Select “Start project run” from the project menu
  4. Load your site’s page from a browser
  5. Ensure that the profiler has connected to aspnet_wp.exe in the messages list
  6. Perform your tasks to profile
  7. Click the “Stop Run” button in nprof

Screenshots:

Read full post

I had made a mistake in packaging 0.6 and forgot to include NProf.Hook.dll. This has been corrected in the 0.7 package.

Sorry for the inconvenience.

Read full post

The nprof 0.6 alpha release is now available. Changes in this version are:

  • Fixes for recursive function calls
  • Some minor GUI updates (double-click profiler runs to open)
  • VS.NET add-in work - moved enable item to menu
  • Fixed major slowdown in large profiler runs introduced last version

Those people who use the VS.NET add-in should be very happy to know that it’s been worked on a fair bit. It should perform as expected now (at least it did in my testing).

The problem with recursive calls messing up the percentages has been fixed. With any luck I haven’t introduced any bugs with the other numbers. I’ve managed to profile an entire run of nprof with some good looking numbers. I’ve also changed the numbers that are displayed on the profile run list. They are:

  • # of calls: The total number of calls to the method
  • % of total: The percentage of total time (relative to the thread’s lifetime) spent in or under this method. This includes all time in methods called by this one.
  • % in method: Percentage of total time (relative to the thread’s lifetime) spent in the method itself.
  • % in children: Percentage of total time (relative to the thread’s lifetime) spent in the children of the method. This does not include time spent in the method called by children of children (or any other call to the method below itself).
  • % suspended: Percentage of total time (relative to the thread’s lifetime) during which the function was suspended.

In a future version I will allow customization of the displayed data columns, as well as batch sorting of the items.

Finally, I fixed a bug that I introduced in 0.5 that made large profile runs load very slowly (it was sorting the listview on each insertion). Large profile runs should no longer cause any grief.

Read full post

The nprof 0.5 alpha release is now available. Changes in this version are:

  • Improved UI (about box, new project icon)
  • Fixed sorting - faster, doesn’t crash
  • Removed GUILibrary dependency
  • New NAnt build scripts
  • Fixed callee timing percentages (now display as % instead of useless total ticks)
  • Added suspended time in callee description
  • Added command-line interface for SharpDevelop integration

The big change for me is the NAnt integration. This should allow me to release nprof more often (by removing the previously tedious and error-prone release steps). It should also help anyone interested in enhancing nprof to get a packaged release for testing.

Read full post

It’s been a while since I last put any news on this page, so I thought I’d do a quick update:

  • Number one priority for me is getting nprof building with NAnt. This makes it easier for me to release new versions, and less likely to put them off. :)
  • Number two priority is fixing some of the numbers within the profiler that are supposed to be showing percentages, but are showing decimals instead.
  • Number three priority is fixing the VS.NET integration once and for all. When I first wrote the code, I didn’t really understand how to do it properly. I think I’ll still go for launching VS.NET windows externally, but I might switch to an external process call to get around some of the strange focus issues.
  • Other priorities are currently undecided. Feel free to send your input.

There’s been some external developer interest in the project as well. I’ll let everyone know if we pick up some extra development hands.

Read full post

I was considering adding a new feature to the profiler, but I’m looking for some feedback before starting. My idea is to hook up a function call tracer that could be enabled or disabled at any time during the profile run. This would allow you to track function calls made in response to a user action, such as clicking the mouse or hitting a keystroke. Ideas? Suggestions? Send them to the mailing list.

Read full post

The nprof 0.4 alpha release (both binaries and source) is now available! The tabbed interface has been improved and a number of bugs have been fixed.

Note: there was a last-minute correction to the download, for those who might have jumped on it after it was released. The latest filename should be nprof-0.4a-alpha.zip.

Remember to send me some feedback if you’re trying it out.

Screenshots:

Read full post

The nprof 0.3 alpha release (both binaries and source) is now available! The new feature this time is a tabbed profiler interface. The source zipfile is a direct dump of CVS, so it should compile fine for you.

The VS.NET add-in is very basic right now and has some issues with VS.NET stealing focus. This will be enhanced in future versions. See the README.TXT file for more information.

Remember to send me some feedback if you’re trying it out.

Read full post

Contrary to popular belief, I’m not dead and neither is this project. :) I’m busy getting ready to release the next version of NAnt, the other open-source project I work on. Unfortunately, I only have a limited number of hours per week to devote to all of the projects I contribute to. This means that progress might be spotty at times depending on whether I’ve gotten to something or not.

As for the code in CVS, I’ve had reports of it not being compilable. Unfortunately, there have only been a few reports in total. Let me know how the code works for you if you’ve had a chance to try it out!

I would be interested in feedback about features or development priorities as well. If you have any suggestions, please send them to the nprof-developers mailing list (subscribe).

Read full post

I’m trying to import the nprof source into CVS as we speak, but I think the Sourceforge servers are down. This may have to wait a day or two. There is currently a source zip snapshot on the Files page for interested parties to take a look at.

Update - whadayaknow? I managed to get it uploaded.

Read full post

The nprof 0.2 alpha release is now available! Some of the new features include:

  • More accurate numbers for total time %
  • Correctly handles exceptions thrown
  • GUI allows working directory and arguments to be specified
  • Namespace filter to filter timing info by specific combinations of namespaces
  • Basic VS.NET add-in

The VS.NET add-in is very basic right now and has some issues with VS.NET stealing focus. This will be enhanced in future versions. See the README.TXT file for more information.

Main window:

VS.NET add-in:

Read full post

The next alpha release (0.2) of nprof is currently in development. The exciting new feature in this release is Visual Studio integration.

By installing this VS.NET add-in, you will be able to enable profiling for your .NET projects from within the environment!

Read full post

The nprof 0.1 alpha release is now available! Some of the new features include:

  • Ability to profile managed/unmanged code transitions
  • Profiler now tracks runtime suspended time
  • Thread-aware GUI, filter timing info by thread
  • More accurate numbers for total time %
  • Show % time in method as well as % time in children
  • Check for profiler hook version number, ability to veto profiler hook if mismatched version

Screenshot:

Read full post

The first version of nprof (0.0) is in preparation for release.

The currently available features are:

  • Multithreaded profilee support
  • Callee function timing
  • Basic GUI interface
  • Sort by timing info

nprof is designed to be not only a profiling application, but a fully-featured API that can be used to build other profilers, as well as extend the default API.

See the project page (no longer available!) for more information.

Read full post